A US map of mountain ranges provides a clear visual representation of the country's diverse topography, helping students and explorers identify major geological features like the Rockies and Appalachians. These printable resources are vital tools for building geographic literacy.
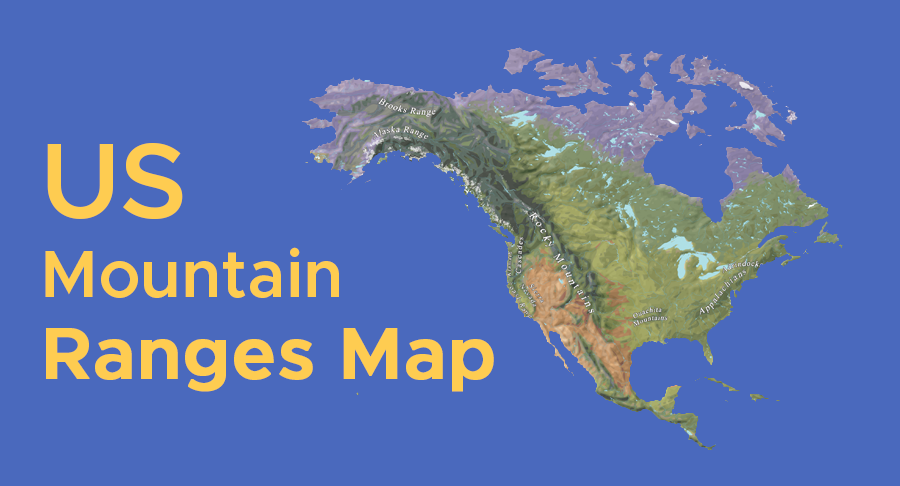
A US map of mountain ranges is a specialized physical map designed to highlight the elevated terrain and tectonic features of North America. By visually demarcating regions like the Sierra Nevada, the Cascade Range, and the Appalachian Mountains, these maps allow users to see how elevation impacts climate, settlement patterns, and travel routes. They serve as a foundational reference for understanding why certain areas of the country remain rugged and sparsely populated while others facilitate agricultural or urban expansion.
Why Use Printable Maps?
Printable maps offer a tactile learning experience that digital screens cannot replicate, allowing users to draw, highlight, and annotate important geological data directly onto the page. They are particularly effective for classroom settings where students benefit from physical engagement, such as coloring different mountain elevations or tracing historical migration paths through mountain passes. Furthermore, these maps are highly portable and accessible, requiring no batteries or internet connection to support a lesson plan or a backyard geography project.
When exploring the cartography of the United States, users encounter several categories of maps, each serving a distinct purpose. Physical maps focus exclusively on landforms such as peaks, basins, and plateaus, providing a clear view of the country's natural skeleton. Labeled maps serve as excellent reference guides for memorizing names and locations, while blank outline maps are superior for testing knowledge and reinforcing spatial memory. Thematic maps take this a step further by layering geological data over political boundaries, allowing students to visualize how state lines often follow mountain ridges or river valleys.
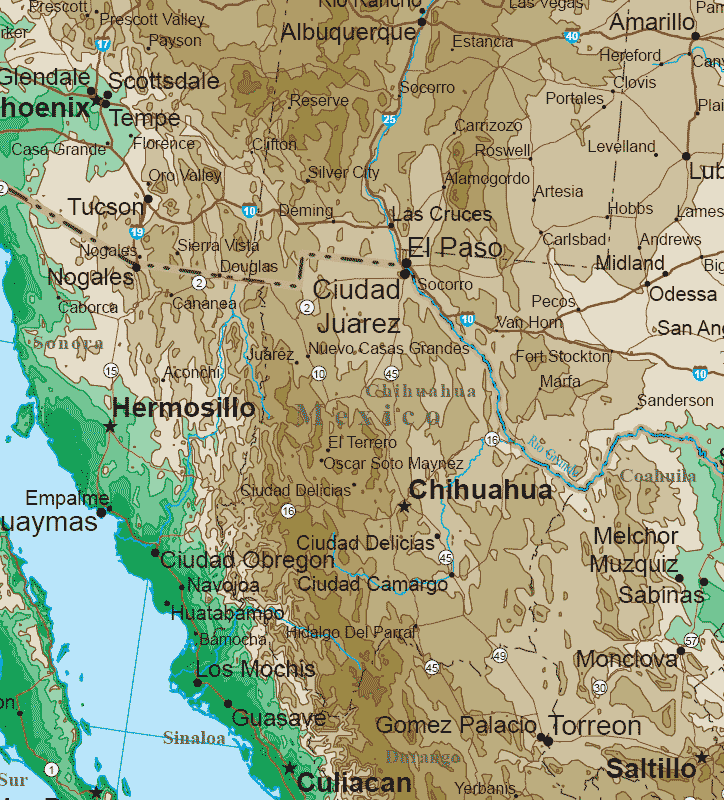
Printable Maps for Different Ages
For elementary school children, printable maps should emphasize bright, simple visuals with large, readable fonts and fewer data points to avoid overwhelming their developing spatial senses. As students advance into middle and high school, the complexity of the maps increases to include topographic symbols, contour lines, and scale bars that require mathematical interpretation. Adults and researchers often prefer monochromatic or highly technical physical maps that provide precise elevation data, demonstrating that the utility of a map evolves alongside the user’s cognitive and academic needs.
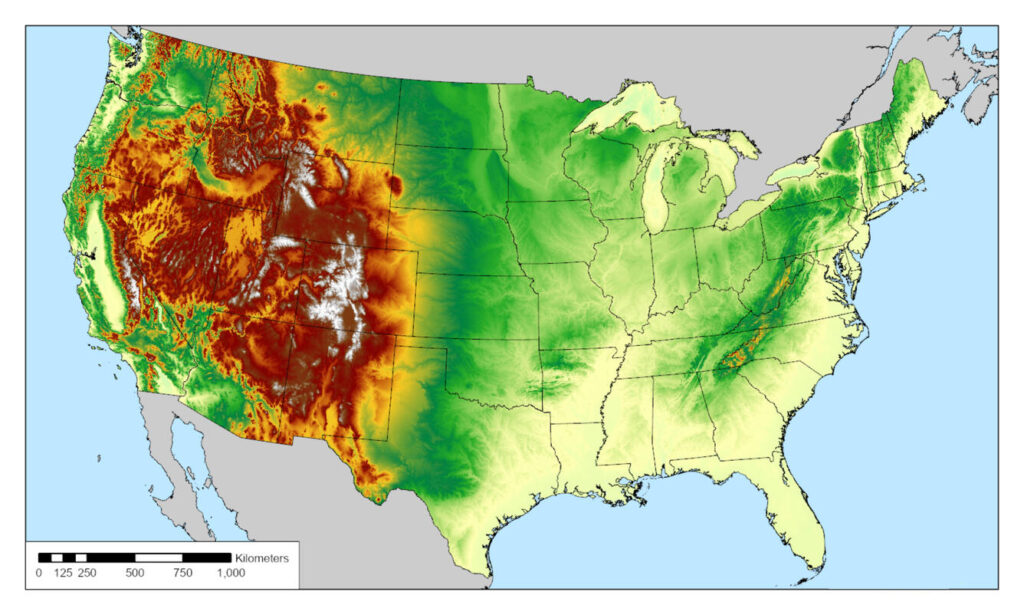
Learning to interpret a map develops essential spatial awareness, including the ability to identify exact locations and understand the relationship between different geographic regions. By studying a US map of mountain ranges, students grasp how symbols represent varied terrain and how a map's scale helps translate a small piece of paper into thousands of miles of real-world distance. Mastering this geographic vocabulary enables learners to describe the world accurately, fostering a better understanding of how physical barriers shape human history and modern infrastructure.
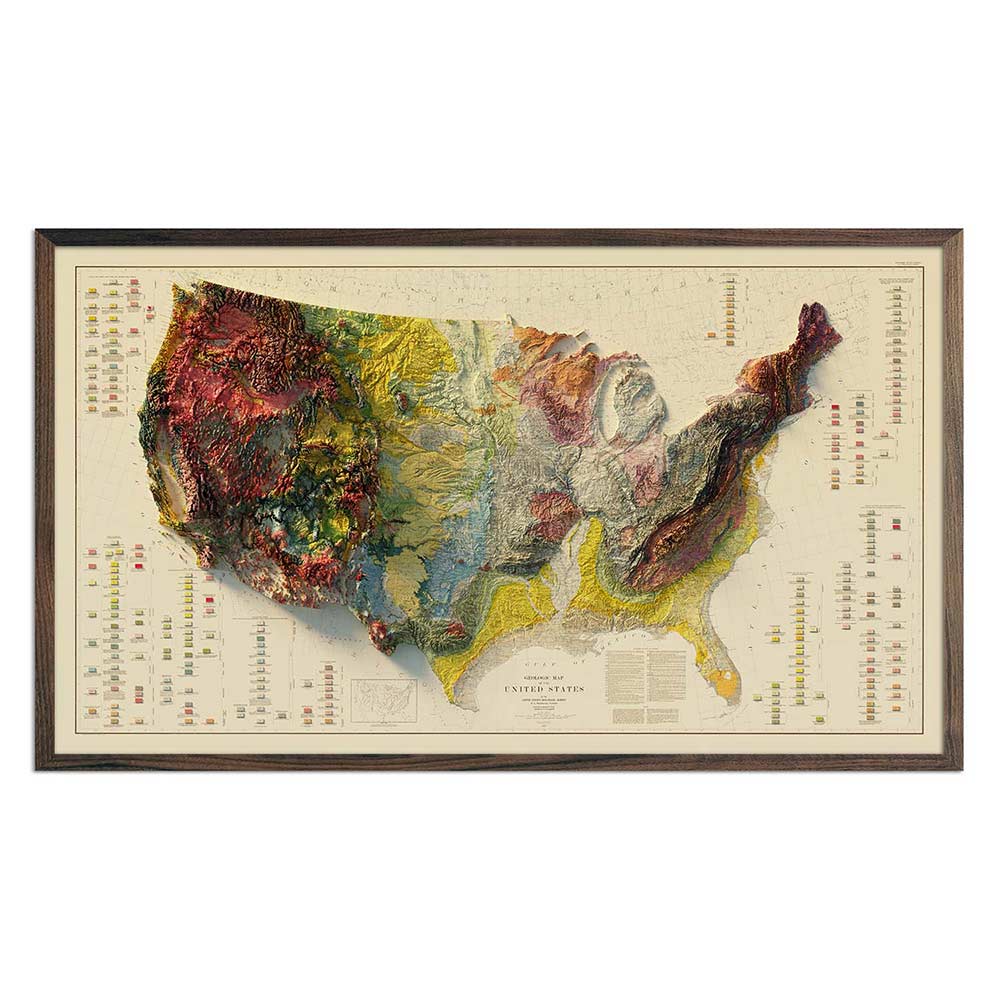
To turn a standard map into a dynamic worksheet, educators can add specific tasks such as requiring students to label the highest peaks or calculate the approximate distance between two mountain ranges using the scale bar. Incorporating research prompts, such as asking students to report on the flora found in the Sierra Nevada, transforms a static image into a base for multi-disciplinary study. Adding coloring instructions for different elevation zones or creating matching games for mountain names and physical descriptions ensures that the map remains an active participant in the student’s learning journey rather than just a passive illustration.